
Your competitive matrix was accurate in February. Someone owned it for two weeks, the team argued about the rows, a designer made it look good, and it shipped to the sales drive as competitive-matrix-v3.
In May a rep on a live call told a prospect that Northwind charges $49 a month per workspace. Northwind had moved to $39 a month plus $0.02 per unit eleven weeks earlier. The prospect had a Northwind quote open in another tab. (Northwind, Harborline, and Ardent are composite competitors we reuse through this guide, with illustrative numbers.)
Nobody lied. The cell was true the day it was typed. A competitive matrix is a photograph of something that keeps moving, and most teams retake the photograph once a quarter by digging through pricing pages, old Slack threads, and whatever the last person wrote in the notes column.
The build is the easy part. Keeping eight rows and four columns true for longer than a sales cycle is the part that fails.
What you'll learn
- Where a competitive matrix stops and a battlecard, SWOT, or landscape map starts
- How to choose three to five competitors instead of listing everyone in the category
- How to write criteria your buyers decide on rather than a feature checklist
- Which sources are trustworthy enough to put in a cell, ranked
- A worked four-by-eight matrix with a 0 to 2 scoring rule you can defend
- How to turn two rows of the grid into a competitor map that shows where nobody sits
- How to attach monitoring to the volatile rows so the matrix stays current
TL;DR: Pick three to five competitors you actually lose deals to, write eight to twelve criteria your buyers decide on, and fill every cell with one fact, a source URL, and a date. Score 0 to 2 so rows are comparable. Then watch the volatile rows on a cadence so the grid updates itself instead of getting rebuilt every quarter.
What a competitive matrix is, and what it is not
A competitive matrix (also called a competitor matrix, competitive grid, competitive analysis grid, comparison matrix, competitive comparison matrix, or competitive assessment matrix) is a table: competitors across the top, decision criteria down the side, one verified fact in every cell. That is the whole artifact. It exists to answer "how do we compare on the things buyers weigh," and it stops being useful the moment you ask it to do strategy, storytelling, or objection handling.
Most teams get into trouble by loading four jobs into one spreadsheet. The rows drift into internal strengths, someone adds a tab for market sizing, a rep pastes in three rebuttals, and the grid becomes a document nobody trusts because no single part of it is maintained. Keep the boundaries clear.
| Artifact | Answers | Shape | Who reads it |
|---|---|---|---|
| Competitive matrix | How do we compare on the criteria buyers use? | Grid: competitors by criteria, one fact per cell | Product, marketing, leadership |
| SWOT | What is true about us, internally and externally? | Four quadrants, one company | Leadership, planning |
| Battlecard | What do I say on a call against this one rival? | One competitor, objections and traps | Sales, in the moment |
| Landscape map | Who else is in this category and where do they cluster? | Two axes, many logos | Investors, category positioning |
| Feature comparison matrix | Does each product have each feature? | Checkmarks by feature | Buyers, on a comparison page |
The competitive analysis matrix feeds the other three. Your battlecard pulls the row where you lose. Your positioning pulls the column with the most white space. Your SWOT pulls the pattern across rows. Build the grid first, then derive the rest, and the derived artifacts stay consistent with each other because they share a source. For the monitoring layer that keeps cells current automatically, see what is competitor monitoring.
Two boundaries are worth stating out loud. A matrix is not a scoreboard where you win: if your product scores highest on every row, you wrote the rows from your roadmap. And a matrix is not a research dump. Eight to twelve rows with sources beats forty rows of half-remembered facts, every time.
If you need the wider frame around how this fits with monitoring, win-loss, and analysis, what is competitive intelligence covers the discipline this artifact belongs to.
Pick the three to five competitors that belong in the grid
Include the competitors that show up in deals you lose, cap the list at five, and put everyone else in a watchlist that never appears in the grid. Column count is the variable that decides whether this thing survives, because every extra column multiplies the cells you have to keep true.
Three tests decide inclusion. First, does the name appear in your lost-deal reasons in the CRM? Second, does a buyer bring it up unprompted on a discovery call? Third, do they rank on the comparison keywords your buyers search? A competitor that fails all three is a category peer, not a rival, and they belong in a list you read quarterly.
For this guide the grid has three rivals plus you:
- Northwind is the incumbent. Bigger, older, sells upmarket, wins on procurement comfort and loses on setup time. Most of your competitive deals include them.
- Harborline is the fast-follower. Similar price, ships weekly, keeps landing features on the roadmap you announced. They win on momentum.
- Ardent is the cheap option. Self-serve, no sales team, undercuts everyone and gives up on anything that needs a contract. They win in deals under $5,000 a year.
That spread is the point. Three competitors who are all the same shape teach you nothing, because every row splits the same way. One incumbent, one fast-follower, and one price-led option gives you rows that disagree, and rows that disagree are where the decision lives.
Two column choices people get wrong. Adding a column for a competitor you have never lost to, because someone in leadership keeps mentioning them. And leaving out the honest column: yourself, scored by the same rule as everyone else. A grid without your own column is a sales asset in disguise.
Keep the watchlist separate and shallow. Names, one line on why they matter, the URL. When one of them starts appearing in lost deals, they get promoted into the grid and something else gets demoted. If you are tracking those extras with tooling, adding a competitor by homepage URL and letting discovery find the surfaces is cheaper than curating pages by hand; the mechanics are in Competitors.
Choose criteria your buyers actually decide on
Write criteria as outcomes the buyer cares about. "Time from signup to first useful result" is a criterion. "Onboarding wizard" is a feature, and a feature row tells the reader nothing about whether the wizard helps.
The test is simple: read the row out loud and ask whether a buyer would use it to choose. "Supports SAML" passes, because a buyer with an IT review either needs it or does not. "Modern architecture" fails. So does anything you cannot verify from outside the company.
Sort the rows into three tiers before you fill anything in.
| Tier | What it does | How many rows | Example |
|---|---|---|---|
| Decisive | Loses or wins the deal on its own | 3 to 4 | Published entry price, SSO availability, data residency |
| Qualifying | Gets you on the shortlist, rarely wins alone | 4 to 6 | API access, integration coverage, support response time |
| Cosmetic | Nice, mentioned in demos, never decides | 0 | Dark mode, dashboard design, mobile app |
Cosmetic rows get zero slots on purpose. They inflate the grid, they are the rows that go stale unnoticed, and they give false comfort when your product is the only one with a checkmark. If a row has never appeared in a lost-deal reason or a discovery question, it is cosmetic.
This is where the feature comparison matrix becomes an anti-pattern. Forty features down the side and checkmarks across produces a grid that always favors whoever wrote it, because the author picks the features. It also breaks the moment a competitor ships a partial version of a feature: is that a check, a half check, a footnote? Buyers read those grids with suspicion for good reason, and internally they hide the two rows that decide real deals inside thirty-eight rows that decide nothing.
Eight to twelve criteria is the working range. Below eight you are missing the qualifying tier. Above twelve, cell maintenance outruns whoever owns it, and the grid dies of quiet inaccuracy before anyone decides to retire it.
One more rule that saves arguments later: write each criterion so a person outside your team could verify it from public pages, docs, or a trial account. If verification requires a friendly customer or a leaked contract, put it in the notes, not the grid.
Where the cell data actually comes from
Cell data comes from vendor pages, trials, public filings, win-loss interviews, and community reviews, but not every source belongs in a cell. Rank your sources before you fill anything in, then record which tier each fact came from. A price you read off the vendor's pricing page and a price a rep heard on a call are both facts, but only one of them survives being challenged in a leadership review.
| Tier | Source | Trust | Refresh burden |
|---|---|---|---|
| 1 | Vendor's own published pages: pricing, docs, changelog, status page | High, dated, quotable | Changes without warning, needs watching |
| 2 | Trial or free account you run yourself | Highest for behavior, workflow, and setup time | Manual, expensive, redo yearly |
| 3 | Public filings, marketplace listings, app store pages, security portals | High and slow-moving | Quarterly is fine |
| 4 | Win-loss interviews and CRM lost-deal notes | High for what buyers believed, not for facts | Continuous, comes from sales |
| 5 | Analyst reviews, G2 and Capterra, community threads | Mixed, often outdated by a release or two | Cheap, verify before using |
| 6 | Competitor sales claims relayed by prospects | Lowest, treat as a lead to verify | Never enter directly |
Tier 6 is where most wrong cells enter a matrix. A prospect says "Northwind told us they include SSO on the Team plan," someone types it into the grid, and six months later a deal turns on a fact that came from a competitor's sales rep through a buyer with an incentive. Log it as a claim, then verify it in tier 1 or 2 before it becomes a cell.
Every cell should carry three things: the fact, the source URL, and the date you checked. Keep them in the cell itself or in a source column next to the grid, but keep them attached. A matrix without provenance cannot be audited, so when two people disagree about a cell the argument is decided by whoever spoke last.
Some rows need a trial account and there is no way around it. Time to first value, real setup burden, and whether the API does what the docs claim are tier 2 facts. Budget a day per competitor per year to run a trial and write down what actually happened, including how long the signup took and what got blocked behind a demo request.
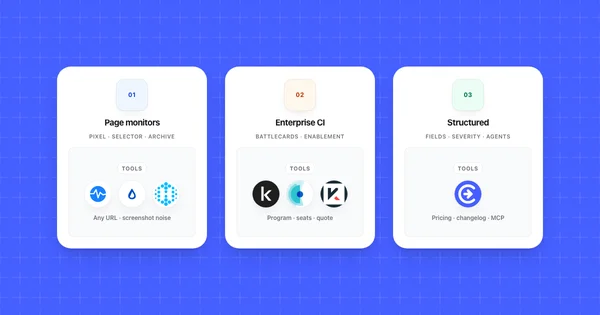
For rows that live on public pages, the question is who watches them. Manual review works for two competitors and a handful of rows. Past that, tooling pays for itself; best competitor monitoring tools for SaaS compares the options by detection model and cost.
Build the grid and score the cells
Put competitors in columns, criteria in rows, and one fact plus one score in each cell. Score on a 0 to 2 scale, because 0 to 5 invites arguments about whether something is a 3 or a 4, and a binary check hides the partial answers that matter most.
The scoring rule, written down once so everyone applies it the same way:
- 0 means no, or not available at the tier a buyer would purchase.
- 1 means partly, with a condition: available on a higher plan, in beta, manual, or documented but limited.
- 2 means yes, at the tier a typical buyer would buy, with no asterisk.
A 1 is the most informative score on the sheet. It is the score that tells a rep "they have it, but only on Enterprise," which is the sentence that wins deals. If your grid has no 1s, someone is rounding.
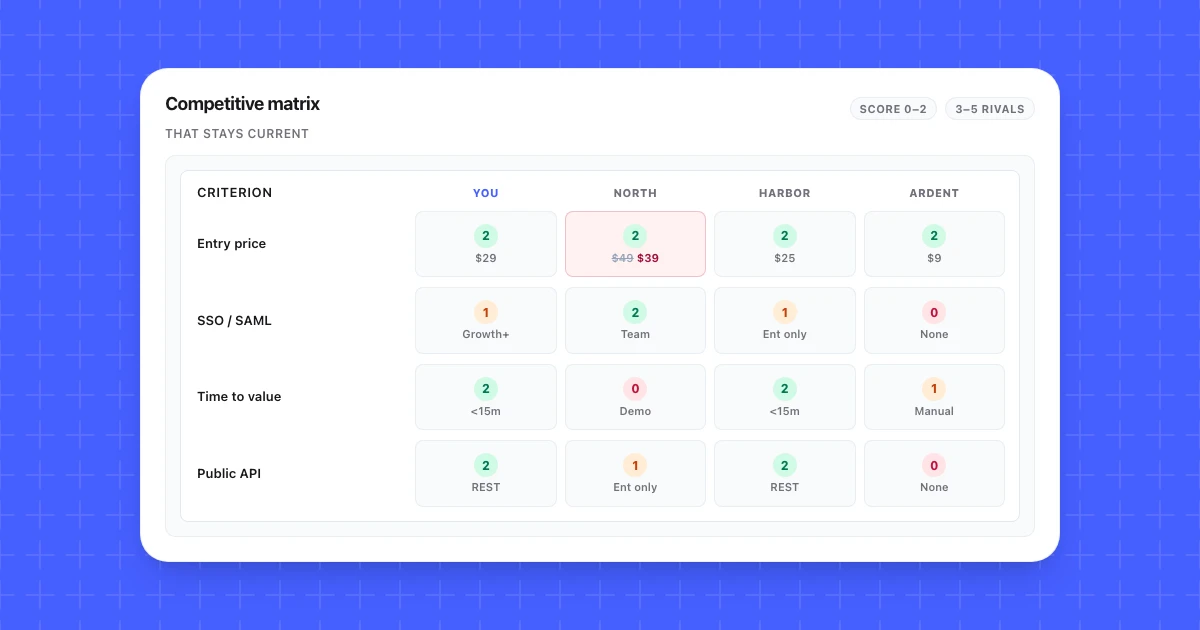
Here is the worked grid: three rivals plus you, eight criteria, decisive rows first.
| Criterion | You | Northwind | Harborline | Ardent |
|---|---|---|---|---|
| Published entry price (per month) | 2 · $29, listed | 2 · $39 plus $0.02/unit, listed | 2 · $25, listed | 2 · $9, listed |
| Price predictability at 10x usage | 2 · flat per workspace | 0 · usage rate compounds | 1 · flat to 50k events, then metered | 2 · flat |
| Time from signup to first result | 2 · under 15 min, self-serve | 0 · demo required before trial | 2 · under 15 min | 1 · fast, but manual setup |
| SSO / SAML at the tier buyers purchase | 1 · Growth plan and above | 2 · included on Team | 1 · Enterprise only, quoted | 0 · not offered |
| Public REST API | 2 · documented, no gating | 1 · available, Enterprise only | 2 · documented | 0 · none |
| Data export without a support ticket | 2 · CSV and JSON in-app | 1 · CSV, support request | 2 · CSV in-app | 1 · CSV, weekly cap |
| Support response commitment | 1 · next business day, no SLA | 2 · 4-hour SLA on Team | 1 · next business day | 0 · community forum |
| Security page with SOC 2 status | 2 · SOC 2 Type II, dated | 2 · SOC 2 Type II | 1 · Type I, Type II in progress | 0 · no security page |
Read a column and you get a shape. Northwind trades setup friction for procurement comfort: they own SSO and the support SLA and lose the two speed rows. Ardent is the price row and nothing else. Harborline is your near-twin, which is why they show up in the same deals.
Alongside the grid, keep the provenance. One row, expanded:
| Cell | Fact | Source | Checked |
|---|---|---|---|
| Northwind, entry price | $39/mo plus $0.02 per unit | https://northwind.example/pricing |
2026-07-14 |
| Northwind, SSO tier | SAML included on Team | https://docs.northwind.example/sso |
2026-07-14 |
| Northwind, support SLA | 4-hour first response, Team and above | https://northwind.example/support |
2026-06-02 |
Notice the third row is six weeks older than the others. That gap is the useful part. When a cell gets challenged, the date tells you whether to defend it or go check it, and a grid where every cell shares one date is usually a grid where nobody checked anything after the first pass.
Two formatting choices that pay off. Do not color the whole grid green for your column, because the reader stops believing the sheet in about four seconds. And do not average the scores into a total. A total implies the rows carry equal weight, and they never do: one 0 on a decisive row loses more deals than four 2s on qualifying rows win.
Build a competitor analysis table in Excel or Google Sheets
A competitor analysis table in Excel or Google Sheets is this same grid on two tabs: scores on the first, and the fact, source URL, and checked date for every cell on the second. Splitting them keeps the score cells numeric, so the spreadsheet can color them, and keeps the provenance one click away.
- Grid tab. Criteria go down column A, decisive rows first. Each competitor gets a column, including yours, and each cell holds only the 0, 1, or 2.
- Sources tab. One row per grid cell: competitor, criterion, fact, source URL, checked date. It is the provenance table above, extended to every cell.
- Color scale by score. Select the score cells, then in Google Sheets open Format > Conditional formatting > Color scale, or in Excel open Home > Conditional Formatting > Color Scales. The color follows the score, so a 0 in your column looks exactly like a 0 in Northwind's.
To skip the typing, the comparison matrix generator at the end of this guide downloads the grid as a CSV that opens in either app. Cells where you entered a fact export as "2: fact", so move the facts to the Sources tab and leave only the number before you add the color scale.
The rest of the workbook setup lives in the competitor analysis template guide: a frozen header row, a confidence dropdown, and a rule that highlights any row whose checked date is more than 30 days old.
Competitive matrix examples: grid, positioning map, and weighted profile
The common competitive matrix examples are the scored grid, the feature matrix, the 2x2 positioning matrix, the weighted profile, and the pricing matrix, plus published analyst grids such as the Gartner Magic Quadrant and the G2 Grid. The first five are built from the same grid, cut a different way, so choose the shape by the question your reader is asking.
| Type | Shape | Use it when |
|---|---|---|
| Scored grid | Competitors across, criteria down, one fact and a 0 to 2 score per cell | You need the source of record every other view pulls from |
| Feature matrix | Checkmarks by feature | A buyer asks "does it have X?" and the honest answer is yes or no |
| 2x2 positioning matrix | Two criteria as axes, one point per competitor | One slide has to show where rivals cluster and which corner is empty |
| Weighted profile | Each row gets a weight, the weights add up to 1.0, and weight times rating is summed into one score per competitor | Someone needs a single number, and you can show the weights and the cells beside it |
| Pricing matrix | Plans across; price, unit, usage limits, and feature gates down | Price is the row you lose on, and one cell cannot hold a plan structure |
| Gartner Magic Quadrant | Two axes, Ability to Execute (vertical) and Completeness of Vision (horizontal), and four quadrants: Leaders, Challengers, Visionaries, Niche Players | You want an analyst's read on the category you sell into |
| G2 Grid | Products plotted by Satisfaction (from user reviews) and Market Presence, labeled Leaders, High Performers, Contenders, or Niche | You want to know how reviewers rate a rival before a deal |
The weighted profile is the one that argues with the scoring rule above. A weighted total still lets a strong qualifying tier bury a 0 on a decisive row, so if leadership asks for one number, put the weights on the slide and keep the row scores next to the total.
The last two rows rate vendors on criteria you did not choose. So does the Forrester Wave, which scores current offering, strategy, and customer feedback and ranks vendors as Leaders, Strong Performers, or Contenders. Treat all three as tier 5 sources: useful for how a category gets framed, too broad to fill a cell in your grid.
Competitor map: turn the grid into a positioning chart
A competitor map, also called a competitive positioning matrix or market positioning matrix, plots each rival by its score on two rows of your grid, so you can see who clusters and which corner nobody holds. Build it from the scores you already have, not from where your gut puts the logos.
A landscape map covers the whole category with many logos; a competitor map covers the three to five columns in your grid. That is competition mapping with the guesswork removed, and the chart is small enough to draw by hand: a 3x3 range in the sheet with names typed into the cells, or two axes and four dots on a slide.
To choose the axes, pick two rows where the rivals land on different scores (entry price fails, since every column scores 2) and that measure different things. Then prefer a pair where you do not win both axes. A map with your logo alone in the top-right corner reads as marketing.
From the worked grid, support commitment (across) and price predictability at 10x usage (down) land You and the three rivals in four different cells:
| Price predictability at 10x | Support 0 · community forum | Support 1 · next business day | Support 2 · 4-hour SLA |
|---|---|---|---|
| 2 · flat | Ardent | You | (nobody) |
| 1 · flat, then metered | Harborline | ||
| 0 · usage rate compounds | Northwind |
A 0 to 2 scale gives a 3x3. For four quadrants, count 2 as high and 0 or 1 as low; that puts You and Ardent in the same box, which is its own finding, since on these two rows the cheap option looks like you. Either way the read is the empty corner: nobody pairs flat pricing at volume with a support SLA, and you are one support score away from it. That is a roadmap question with a price tag.
The map is a derived view. It shows two of the eight rows and hides the other six, including SSO, where Northwind leads. Label both axes with the row names so nobody reads it as an overall ranking, and redraw it whenever a cell in either row changes.
Read the matrix: gaps, white space, and the row where you lose
Read the grid three ways: down your own column for gaps, across each row for white space, and at the single row where you lose most often. Each read produces a different decision, and teams that only do the first one end up with a roadmap that chases parity.
Read down your column. Every 0 and 1 in your column is either a roadmap item or a positioning choice. SSO on Growth and above is a 1, and the honest question is whether moving it down a tier wins more deals than the revenue it protects. Write the answer next to the cell. A gap you have decided not to fix is a decision, and it stops being relitigated every quarter once someone records it.
Read across each row. Look for rows where every column scores 0 or 1. That is white space, and it is worth more than any parity gap in your column. In the worked grid, price predictability at 10x usage is close: Northwind is a 0, Harborline is a 1, and only you and Ardent hold a flat model. If buyers care about that and nobody markets it, you have a positioning line nobody else can copy this quarter.
Read the row where you lose. Pull the CRM, find the criterion that appears most in lost-deal reasons, and treat that single row as its own project. Usually it is price, setup burden, or a compliance gate. Pricing rows deserve their own watch because they move without announcement, which is covered in how to monitor competitor pricing pages.
Then turn the grid into the artifacts people will actually open. Nobody reads the master sheet except the person who maintains it.
| Audience | Artifact | What it contains | Cadence |
|---|---|---|---|
| Sales | One battlecard per competitor | That column, the two rows you win, the row you lose, the honest answer to the price objection | Updated when a cell changes |
| Leadership | One slide | Your column's 0s and 1s, plus the white-space row, with dates | Monthly or on request |
| Product | Gap list | Every 0 and 1 in your column, with the decision recorded next to it | Quarterly planning |
| Marketing | Comparison page brief | Rows where you score 2 and a named rival scores 0 or 1, all sourced | When the sheet changes |
Three rules for presentation. Show dates, because an undated competitive claim gets discounted by anyone reading it. Never present a cell you cannot source, since the one question a skeptical exec asks is "where did that come from." And put your own 0s on the slide. A grid where you win every row gets read as marketing and gets ignored accordingly.
Keep the matrix current without quarterly archaeology
Attach a refresh cadence to each row based on how fast that fact moves, then automate the fast rows. A matrix does not go stale evenly: pricing and feature tiers move quietly and often, while SOC 2 status and support commitments barely move at all.
| Row type | How often it moves | Where the change shows first | Refresh |
|---|---|---|---|
| Price and plan structure | A few times a year, unannounced | Pricing page, sometimes docs limits first | Daily monitor |
| Feature availability and tier gating | Monthly for fast shippers | Changelog, then docs, then pricing page | Daily on changelog and docs |
| Positioning and headline claims | Quarterly | Homepage, comparison pages | Weekly monitor |
| Integrations and API surface | Monthly | Docs, integrations directory | Weekly monitor |
| Security and compliance status | Yearly | Security or trust page | Monthly check |
| Support commitments | Rarely | Support or SLA page | Quarterly manual |
| Funding, headcount, acquisitions | Event-driven | Press, filings | News alert, not a page monitor |
The top four rows are the ones that made your February matrix wrong. They are also the rows a page monitor handles well, because they live on public pages the vendor updates deliberately.
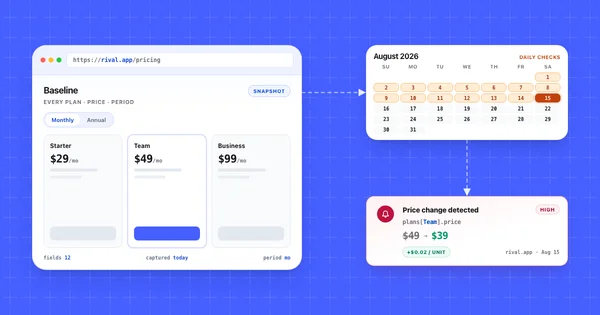
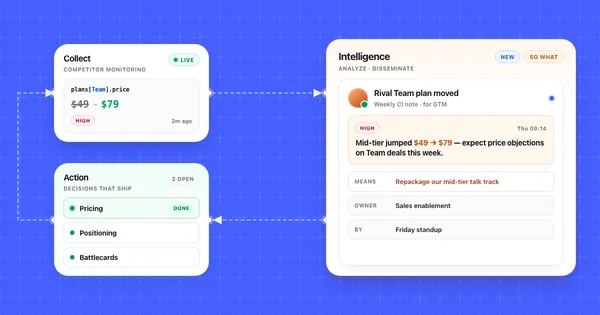
Competiflow fits here: you add a competitor by homepage URL, discovery seeds monitors for pricing, changelog, docs, blog, and homepage, and each check produces an interpreted change with severity and a plain-language summary instead of a highlighted screenshot region. That maps to the grid directly, because a change record names the field that moved, and a field that moved is a cell to update. Cadence and monitor health are covered in Monitors.
To refresh the grid, pull the changes since your last review pass:
curl "https://api.competiflow.com/v1/changes?workspace_id=42&since=2026-02-27T00:00:00Z&min_severity=medium&limit=25" \
  -H "Authorization: Bearer $COMPETIFLOW_API_KEY"
Response (200 OK):
{
  "changes": [
    {
      "id": 901,
      "competitor_id": 7,
      "competitor": "Northwind",
      "monitor_id": 101,
      "monitor_type": "pricing",
      "severity": "high",
      "severity_score": 82,
      "summary": "Team plan moved from $49/mo flat to $39/mo plus $0.02 per unit",
      "why_it_matters": "Northwind's entry price now sits $10 above your $29 flat plan instead of $20, and the usage rate puts them back above their old $49 past 500 units a month.",
      "opportunity_score": 68,
      "review_status": "unreviewed",
      "category": "pricing",
      "direction": "retreated",
      "delta": { "added": 1, "removed": 0, "modified": 1 },
      "created_at": "2026-03-03T06:12:00.000Z"
    },
    {
      "id": 898,
      "competitor_id": 9,
      "competitor": "Harborline",
      "monitor_id": 118,
      "monitor_type": "changelog",
      "severity": "medium",
      "severity_score": 54,
      "summary": "SAML SSO listed as generally available, Enterprise plan only",
      "why_it_matters": "Harborline now clears the IT review gate you have been winning on, though the Enterprise requirement keeps it out of mid-market deals.",
      "opportunity_score": 41,
      "review_status": "unreviewed",
      "category": "feature",
      "direction": "advanced",
      "delta": { "added": 1, "removed": 0, "modified": 0 },
      "created_at": "2026-07-18T06:04:00.000Z"
    }
  ],
  "has_more": false,
  "meta": {
    "counts": { "unreviewed": 2, "acknowledged": 19, "dismissed": 7 },
    "max_unreviewed_severity": "high"
  }
}
Two changes, two cells. The first rewrites Northwind's price row and drops their price predictability score, since a usage rate that compounds at 10x volume is no longer a flat model. The second moves Harborline's SSO cell from 0 to 1, not to 2, because the feature landed behind the Enterprise tier. That distinction is the whole reason the 0 to 2 scale exists, and it is the sentence a rep needs on the next call.
Mark each one reviewed once the cell is updated, so the unreviewed count tracks outstanding cell updates:
curl -X PATCH https://api.competiflow.com/v1/changes/901 \
  -H "Authorization: Bearer $COMPETIFLOW_API_KEY" \
  -H "Content-Type: application/json" \
  -d '{"review_status": "acknowledged"}'
Filters, cursors, and the field-level evidence you can pull per change are in Changes.
For the monthly pass, the digest tells you which competitor and which surface moved, which is a fast way to spot the columns going stale:
curl "https://api.competiflow.com/v1/workspaces/42/digest?period=30d" \
  -H "Authorization: Bearer $COMPETIFLOW_API_KEY"
{
  "digest": {
    "period": "30d",
    "generated_at": "2026-07-26T09:00:00.000Z",
    "generating": false,
    "activity_map": {
      "surfaces": ["homepage", "blog", "docs", "changelog", "pricing"],
      "max_count": 7,
      "competitors": [
        {
          "competitor_id": 9,
          "name": "Harborline",
          "homepage_url": "https://harborline.example",
          "total": 7,
          "cells": { "changelog": 4, "docs": 2, "pricing": 1 }
        },
        {
          "competitor_id": 7,
          "name": "Northwind",
          "homepage_url": "https://northwind.example",
          "total": 3,
          "cells": { "pricing": 2, "homepage": 1 }
        },
        {
          "competitor_id": 11,
          "name": "Ardent",
          "homepage_url": "https://ardent.example",
          "total": 0,
          "cells": {}
        }
      ]
    },
    "coverage": {
      "competitors_count": 3,
      "monitors_total": 12,
      "monitors_healthy": 11,
      "monitors_failing": 1,
      "failing_monitor_ids": [118]
    },
    "consumption": {
      "pending": 2,
      "max_unreviewed_severity": "high",
      "reviewed_in_period": 14
    }
  }
}
The activity_map is a matrix of its own: competitors down, surfaces across, change counts in the cells. Seven changes on Harborline against three on Northwind tells you which column needs a careful read this month. And coverage is the part people skip: one failing monitor means a surface you believe you are watching is producing nothing, which is how a cell silently ages for a quarter.
If you work with an AI agent in Cursor or Claude Desktop, the Competiflow MCP server exposes the same data, so you can ask for changes since your last matrix review and get the cells to update without writing the curl; that setup is in monitor competitors with AI agents.
The maintenance ritual is small once the monitoring runs. Fifteen minutes on the first Monday of the month: read the unreviewed changes, update the cells they touch, stamp the dates, mark them acknowledged. No archaeology.
Five mistakes that make a competitive matrix useless
Matrices fail when they sprawl across too many competitors, bake in your own roadmap bias, skip sources and dates, trust marketing claims, or sit without a refresh cadence. These five kill matrices quietly, which is why the sheet keeps getting shared long after it stopped being true.
Too many columns. Eight competitors means eight columns of cells to keep current, and nobody keeps them current. The grid ages into a document people cite on habit, long after the facts inside it stopped being true. Cap at five, keep the rest in a watchlist you read quarterly.
Criteria written from your roadmap. If your column scores 2 on every row, the rows came from your internal plan, not from what buyers actually said in lost deals. The tell is that the grid never changes anyone's mind. Rewrite the rows from CRM loss reasons and discovery-call questions, then rescore.
Cells without a source or a date. An undated fact cannot be audited, defended, or refreshed. Six months later nobody remembers whether the Northwind price came from their pricing page or a prospect repeating a rep. Every cell gets a URL and a checked date, no exceptions.
Treating a competitor's marketing claim as a fact. Vendor comparison pages, sales decks relayed by prospects, and G2 profiles the vendor curates are positioning. Use them to learn what a rival wants to be believed, verify the claim in docs or a trial before it becomes a cell.
No refresh mechanism. The most common failure. A matrix built once and reviewed "as needed" is wrong within one quarter, and the way you find out is a rep quoting a stale price to a prospect who already has the current one. Attach a cadence per row, automate the volatile ones, and give one person the fifteen-minute monthly pass.
There is a sixth worth mentioning: nobody owns the sheet. Shared ownership of a competitive matrix means no ownership, because updating a cell is never anyone's most urgent task. Name a person, put the monthly pass on their calendar, and let them delete rows that stopped mattering.
Frequently Asked Questions
What is a competitive analysis matrix?
A competitive analysis matrix is a grid with competitors in columns and decision criteria in rows, where each cell holds a verified fact about how one competitor performs on one criterion. It exists to make comparison consistent, so a claim about a rival can be traced to a source and a date. Most teams run three to five competitors against eight to twelve criteria.
What is competitive analysis?
Competitive analysis is the practice of comparing your product with the alternatives your buyers weigh, using dated evidence, to make one decision. A competitive matrix is one of its artifacts; our guide to competitive analysis covers the whole process.
How do you analyze competitors?
Pick the rivals you lose deals to, compare them on the criteria your buyers use, and record a source and checked date for every fact. The seven-step competitive analysis process walks through each step.
How many competitors should be in a competitive matrix?
A competitive matrix should include three to five competitors. Fewer than three and the rows do not disagree enough to teach you anything; more than five and cell maintenance outruns whoever owns the sheet. Pick one incumbent, one close rival, and one price-led option if your market has those shapes, and keep everyone else in a separate watchlist.
What is competitive positioning?
Competitive positioning is the deliberate choice of what you are best at for a specific buyer, relative to the alternatives that buyer is considering. In a matrix it starts from the row where every rival scores 0 or 1 and you score 2; the competitive positioning guide covers how to turn that into a positioning statement, with dated SaaS examples.
What is a competitive landscape?
A competitive landscape is the full set of companies a buyer could choose from in your category, including direct rivals, adjacent tools, and the do-nothing option. It is broader than a competitive matrix, which narrows that set to the three to five names that decide your deals.
What is the difference between a competitive matrix and a battlecard?
A competitive matrix compares several competitors across the same criteria; a battlecard covers one competitor in depth for a rep in a live conversation. The matrix is the source of record with facts, sources, and dates. The battlecard is derived from one column of it, plus objection handling, trap-setting questions, and the honest answer to why you cost more.
How do you present a competitor analysis?
When presenting a competitor analysis, show the artifact each audience needs: leadership gets one slide with your gaps, the white-space row, and dates on every claim; sales gets a per-competitor battlecard. Include your own weak scores, because a grid where you win every row reads as marketing and gets discounted on sight. For a draft grid you can copy into Sheets, use the comparison matrix generator at the end of this article.
What is a competitive analysis grid?
A competitive analysis grid is a table with competitors across the top, buying criteria down the side, and one sourced fact in every cell. It is another name for a competitive matrix. Scoring each cell 0 to 2 makes the rows comparable, and a checked date on each cell tells you which facts are due for a fresh look.
What is a competitive positioning matrix (competitor map)?
A competitive positioning matrix, often called a competitor map, is a two-axis chart that places each competitor by its score on two criteria. It shows where rivals cluster and which corner nobody occupies. Take the scores from your grid instead of placing logos by feel, and label the axes, because the map shows two criteria and hides the rest.
What is a competitor analysis chart?
A competitor analysis chart is any visual that compares rivals on the same measures, most often a scored grid or a two-axis competitor map. Keep the grid as the record, since every cell can carry a source and a date. Charts drawn from it, like a positioning map or a color-coded table, belong on slides and should be redrawn when the grid changes.
What is a comparison matrix?
In competitive analysis, a comparison matrix is a grid that compares several competitors on the same criteria, with one fact per cell, which makes it the same artifact as a competitive matrix. The term is also used for generic product comparisons, such as a buyer weighing three vendors or a feature table on a pricing page. The structure holds either way: options across the top, criteria down the side.
A competitive matrix is worth building only if it is worth trusting three months later. That comes from a short competitor list, criteria your buyers actually weigh, one sourced fact per cell, and a scoring rule that admits partial answers.
The maintenance is what separates a live grid from competitive-matrix-v3. Attach a cadence to each row, watch the pricing and changelog pages that move without warning, and spend fifteen minutes a month turning changes into cell updates.
Then when a rep quotes Northwind's price on a call, it is the price Northwind charges today.